General Principles of Equilibrium:
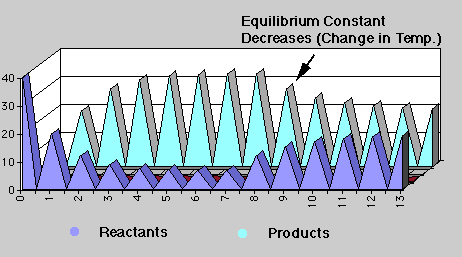
The following graph and table illustrate the general principles of chemical equilibrium.
There are thirteen points in time or "events" where simultaneous transfers from reactants --> products and products --> reactants occur. The percent of the transfers are fixed at 50% and 10% respectively in "events" 0-6 (set one) and equal to 20% in "events" 7-13 (set two). Notice the graph. Equilibrium is established at "event" 5 for the first set of transfers and at "event 12 for the second set, that is, the amounts of reactants and products are no longer changing.
The equilibrium constant for set one is K1 = 4, and K2 = 1 for set two. Notice what happens in the graph. In set two, the concentration of products are less favored than in set one, K2 < K1, and the reactant concentration increases over time. The equilibrium concentrations never become equal even though the percent transfers are equal because the starting concentrations for set two were not equal, 7 and 33 respectively ("event" 7).
The equilibrium constant has changed in the two sets, which does occur chemically with changes in temperature. The relative change is determined by whether the reaction is endothermic or exothermic. If endothermic, an increase in temperature will cause the equilibrium constant to increase. However, if the reaction is exothermic, which the majority of chemical reactions are, the equilibrium constant decreases with an increase in temperature.

| "Event" | REACTANT | Transfer | PRODUCT | Transfer | ||||
| or Time | Amount | Percent/100 | Amount | Percent/100 | ||||
| 0 | 40 | 0.5 | 0 | 0.1 | ||||
| 1 | 20 | 0.5 | 20 | 0.1 | Q= | 1 | ||
| 2 | 12 | 0.5 | 28 | 0.1 | ||||
| 3 | 9 | 0.5 | 31 | 0.1 | ||||
| 4 | 8 | 0.5 | 32 | 0.1 | ||||
| 5 | 7 | 0.5 | 33 | 0.1 | ||||
| 6 | 7 | 0.5 | 33 | 0.1 | ||||
| 7 | 7 | 0.2 | 33 | 0.2 | K= | 4 | ||
| 8 | 12 | 0.2 | 28 | 0.2 | ||||
| 9 | 15 | 0.2 | 25 | 0.2 | ||||
| 10 | 17 | 0.2 | 23 | 0.2 | ||||
| 11 | 18 | 0.2 | 22 | 0.2 | ||||
| 12 | 19 | 0.2 | 21 | 0.2 | K= | 1 | ||
| 13 | 19 | 0.2 | 21 | 0.2 |
© Copyright 1998 R.J. Rusay